Improve crime victims' access to services, programs, and reports?
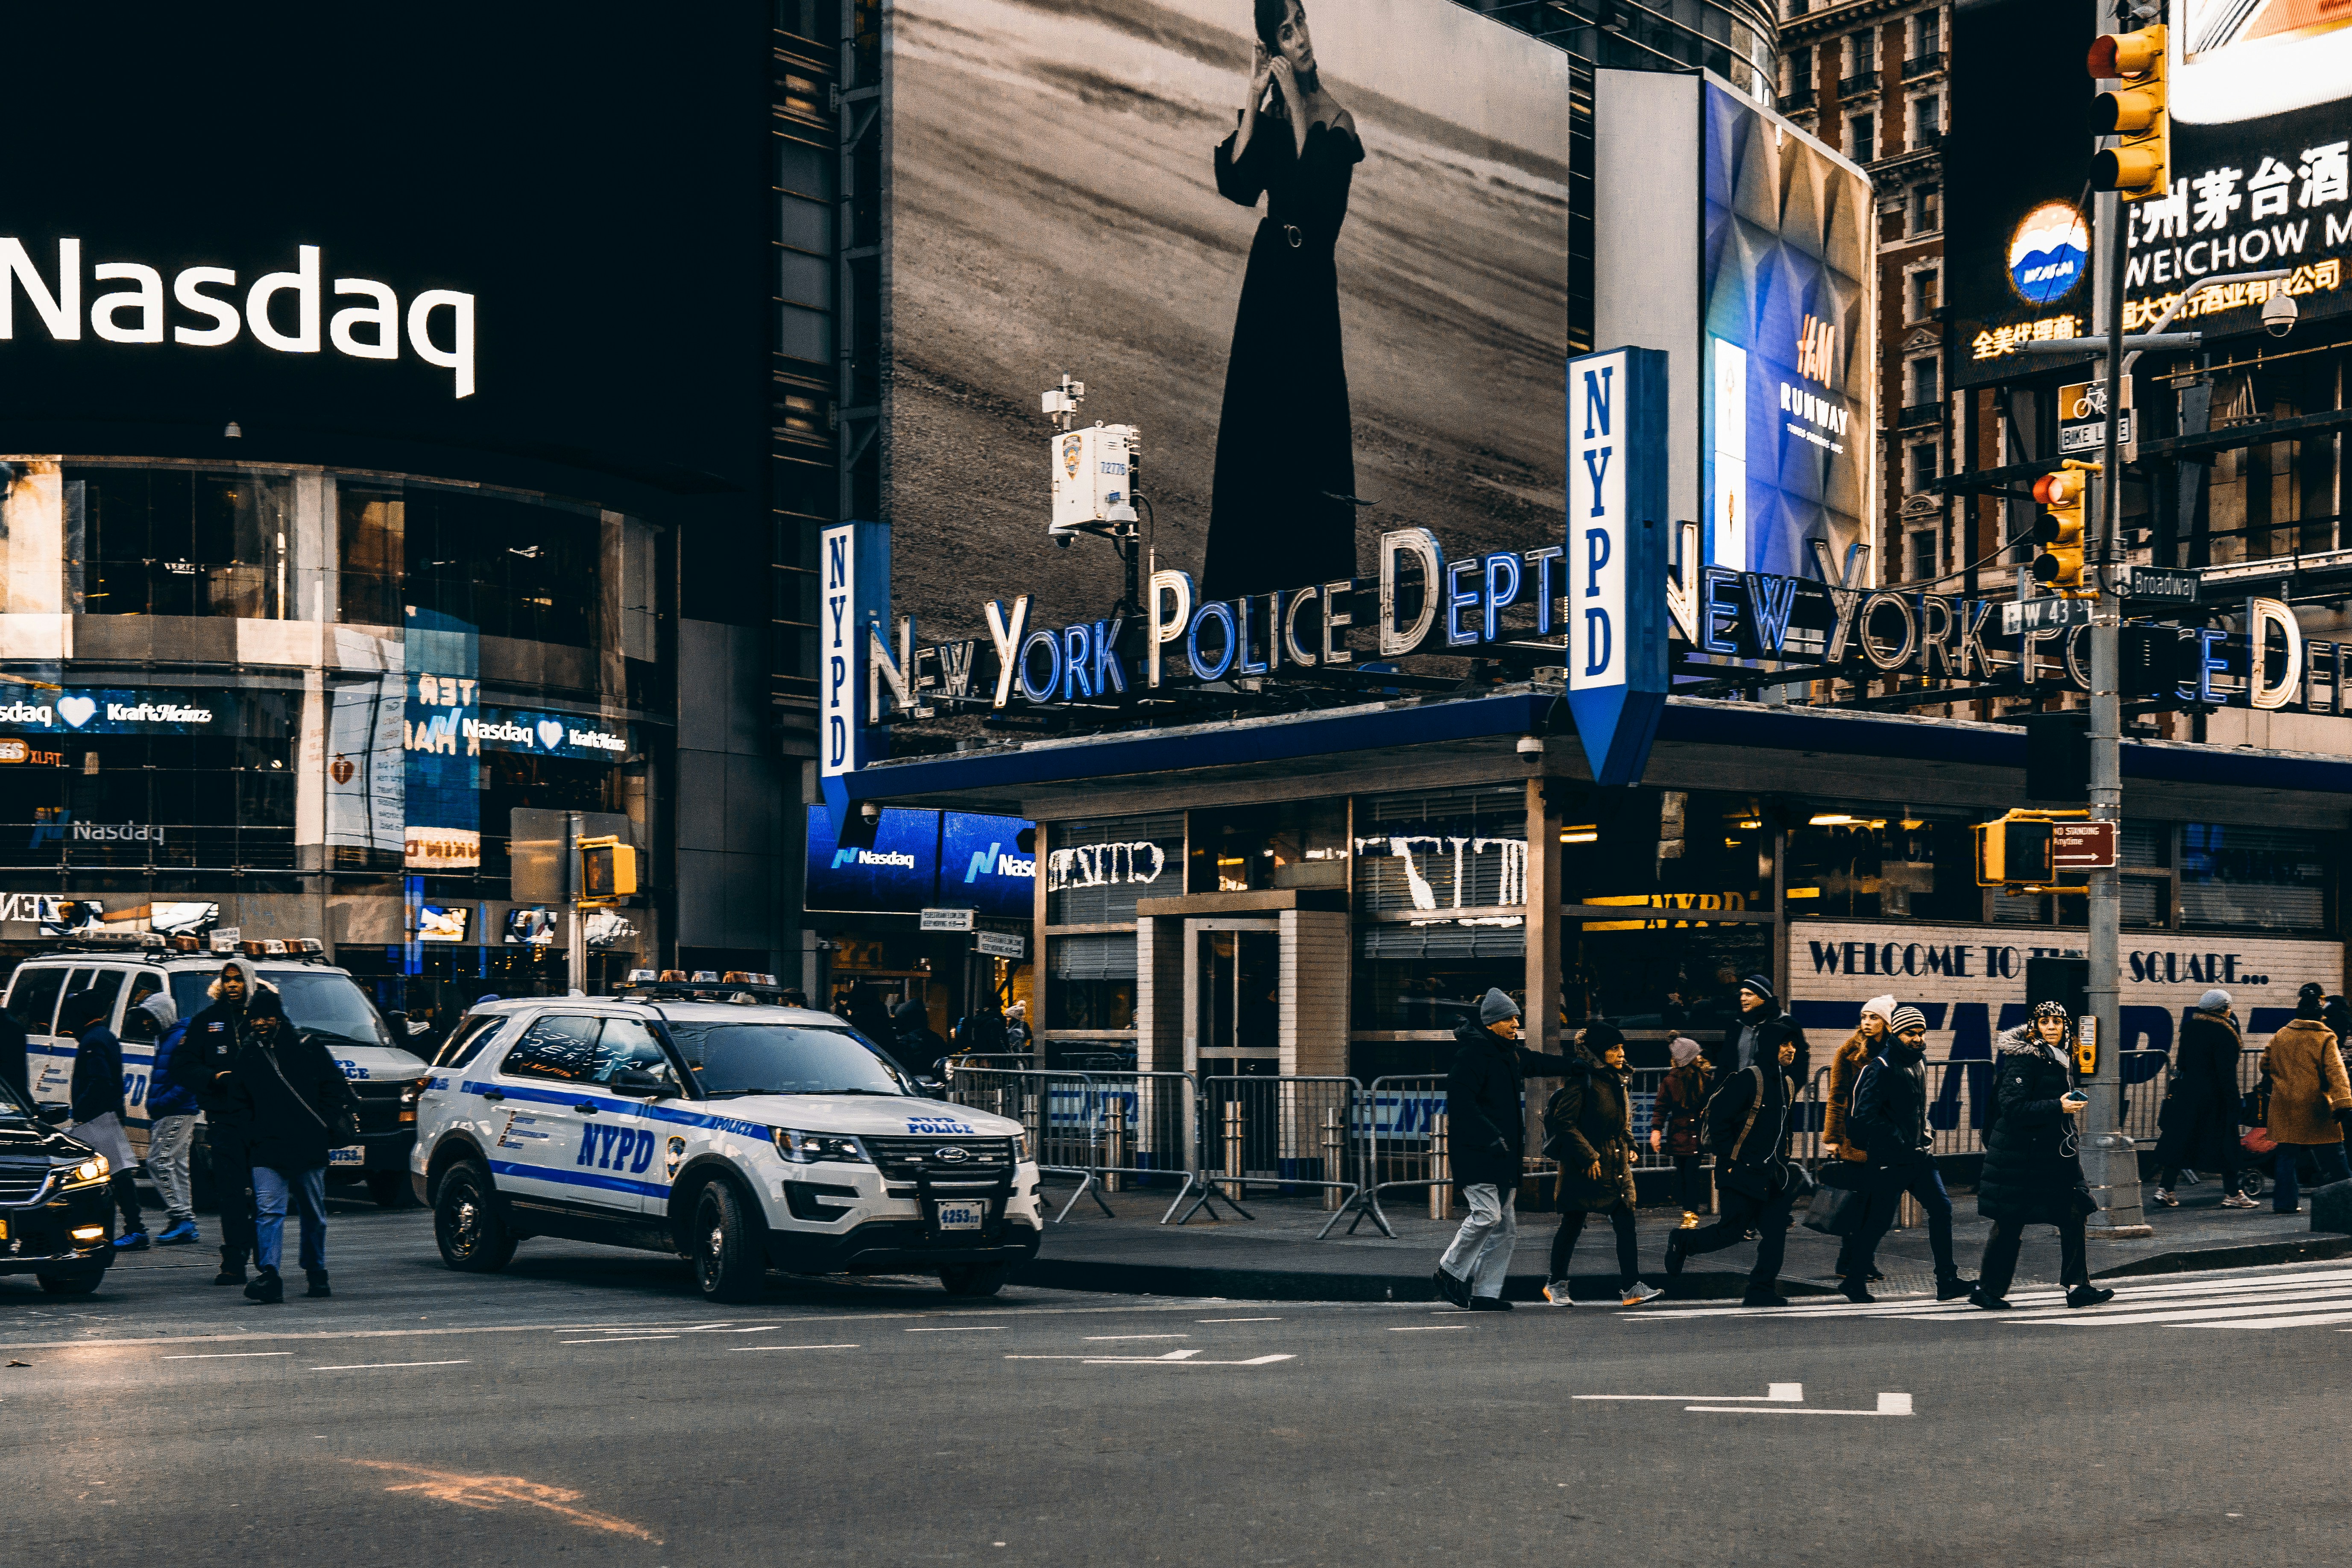
For crime victims in New York City, the reporting experience was a second failure. A 6-hour wait after calling 911. An online portal that created more friction than it solved. And after all that effort, silence.
The gap between what users needed and what the system delivered wasn't just a UX problem. It was a systemic breakdown across communication, response time, and technology that affected victims, officers, and public confidence in the process.
Victims received zero updates after filing. The feedback loop between police and victims was completely broken.
Hours to weeks at every stage, from the initial 911 call to in-person interviews to case resolution.
Officers and victims both lacked the tools to track progress, recover property, or move cases forward efficiently.
My role and contributions.
I led UX research and Figma prototyping, designed the chatbot's full interaction flow, ran Experiments 2 and 3, and presented findings directly to NYPD stakeholders. I also contributed to the Competitive Analysis across 7 players and contributed to the Value Chain Analysis for all three solution concepts.
- 5 members : Operations Research, Product Design, MBA/Product, Computer Science
- Cross-institutional : Cornell Tech × Parsons School of Design
- Client : NYPD, under sergeant supervision
Starting with the user, not the solution.
We conducted 12 interviews (137 minutes) with crime victims, police officers, and service providers. Four themes emerged: a communication gap after filing, an unintuitive NYPD website, wait times spanning hours to weeks, and victims left without tools to track progress.
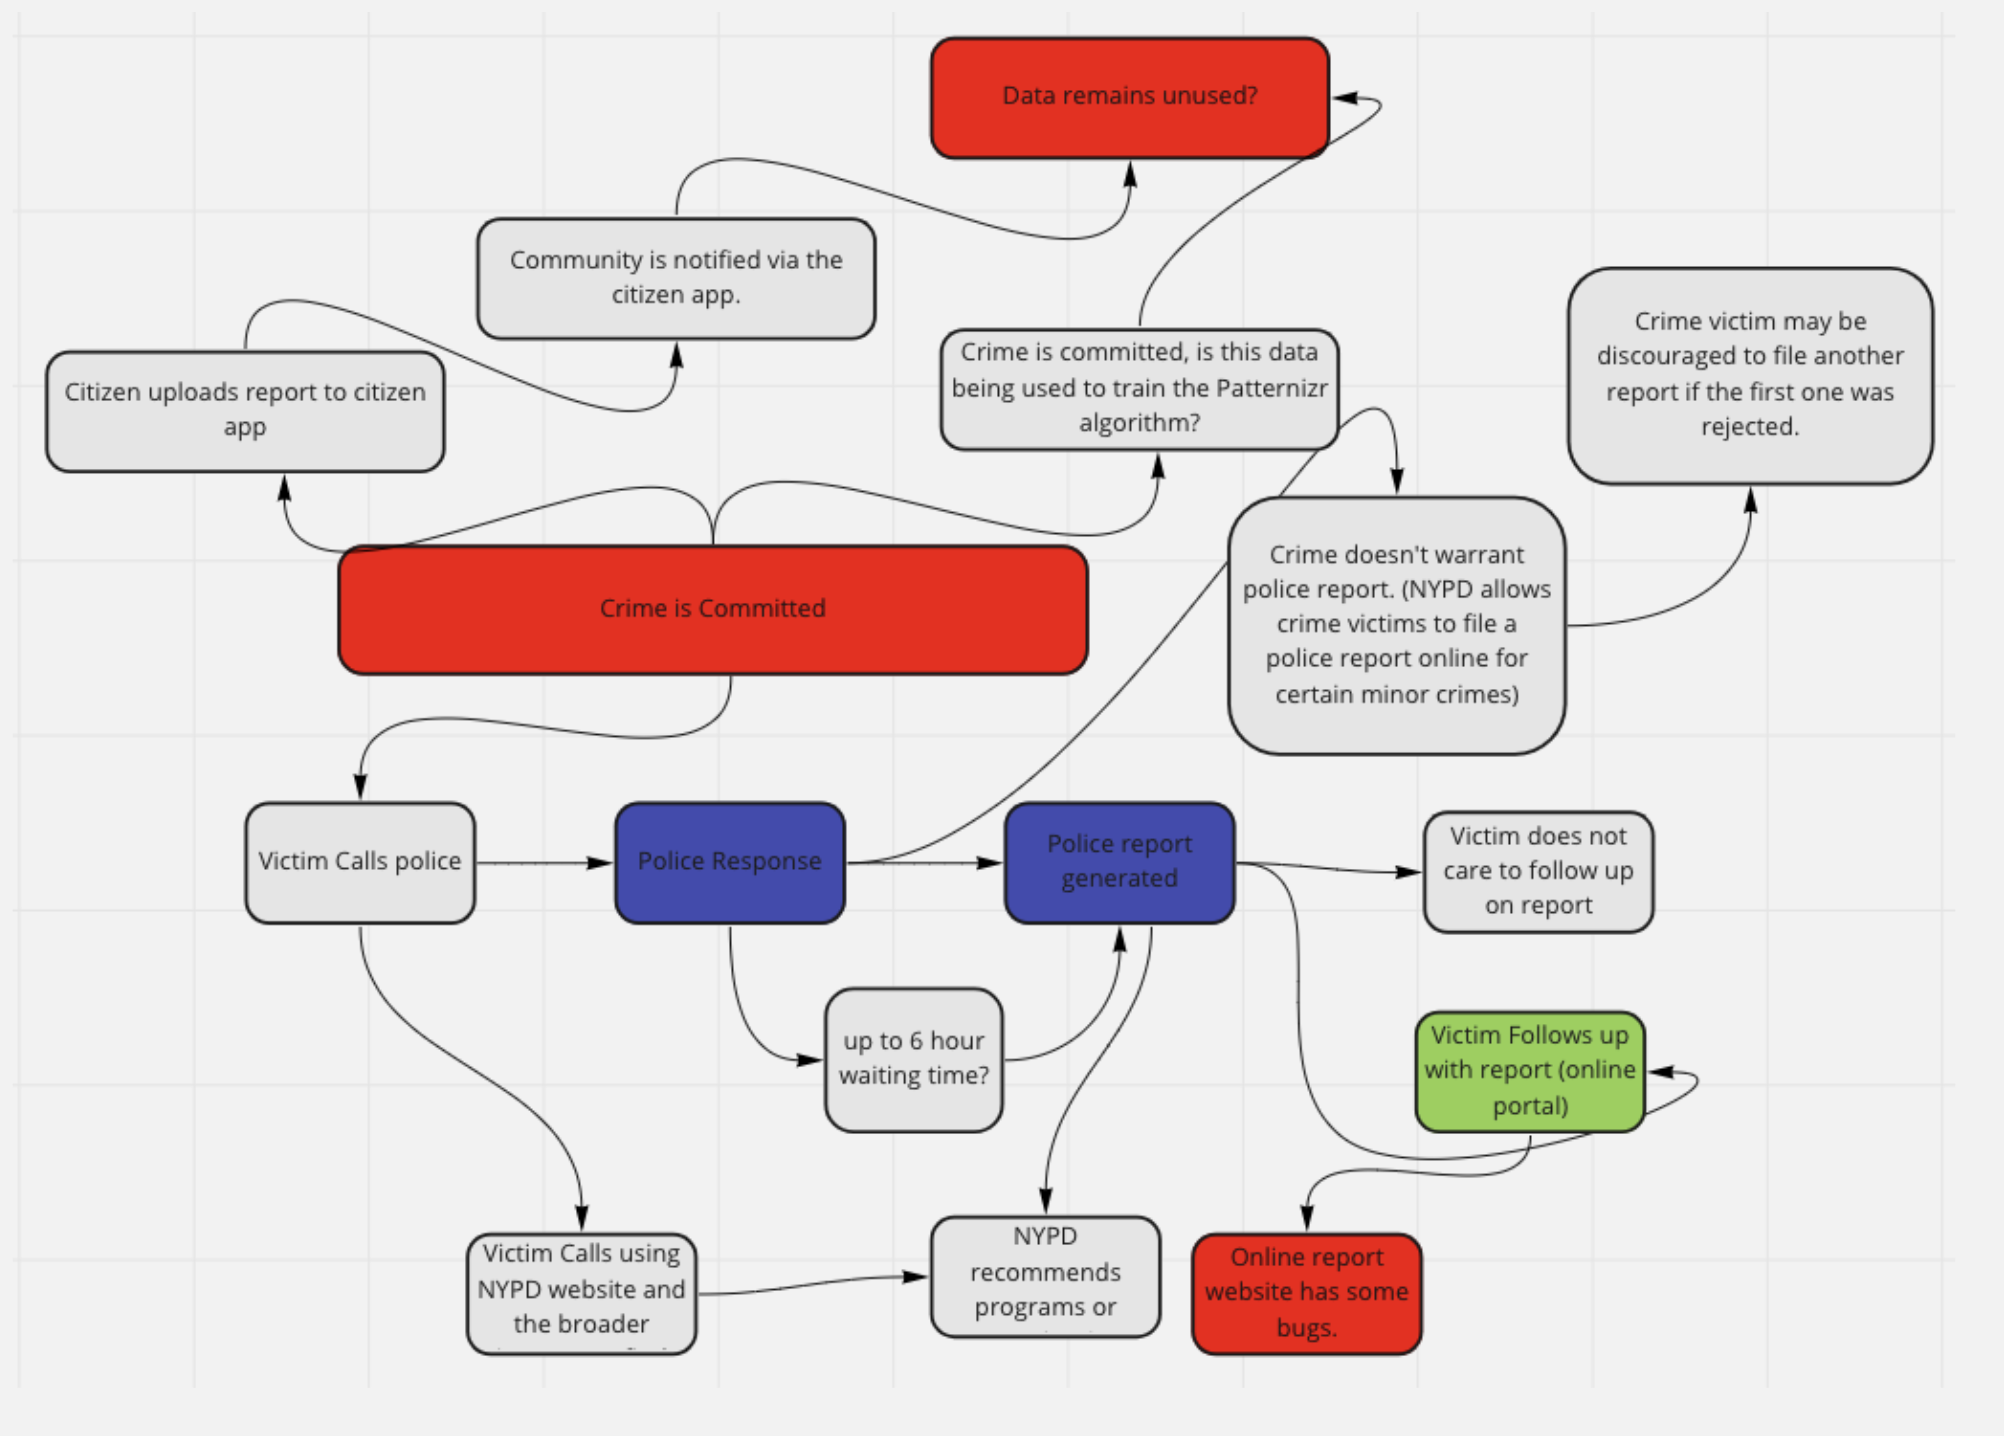
Our systems map surfaced deeper bottlenecks: portal bugs that silently let bad data through, unused data from the Citizen app, and an investigation timeline measured in months.
Mapping the competitive landscape.
I mapped 7 competitors across three tiers. Incumbents (911, NYPD portal, Safe Horizon) were slow and analog. Digital challengers like Citizen ($73M+ raised, sub-10-second premium response) proved demand for faster solutions, but none were tackling report filing itself.
The gap: no one was automating the victim intake process.
I plotted competitors against two dimensions: how tech-enabled their solution was, and how directly it served victims during the filing process.
report filing
6-hour wait times
Buggy, unintuitive
Advocacy, not filing
Dedicated but no scale
Internal NYPD ML tool
$73M+ raised · Alerts, not filing
Non-emergency triage
Narrowing from three concepts to one.
Each concept went through a Value Chain Analysis covering business model canvas, demand/supply evaluation, and feasibility assessment. The chatbot was selected as the only concept that addressed all three problems, was testable within the semester, and had the strongest user-need-to-feasibility alignment. The remaining concepts were documented as future phases.
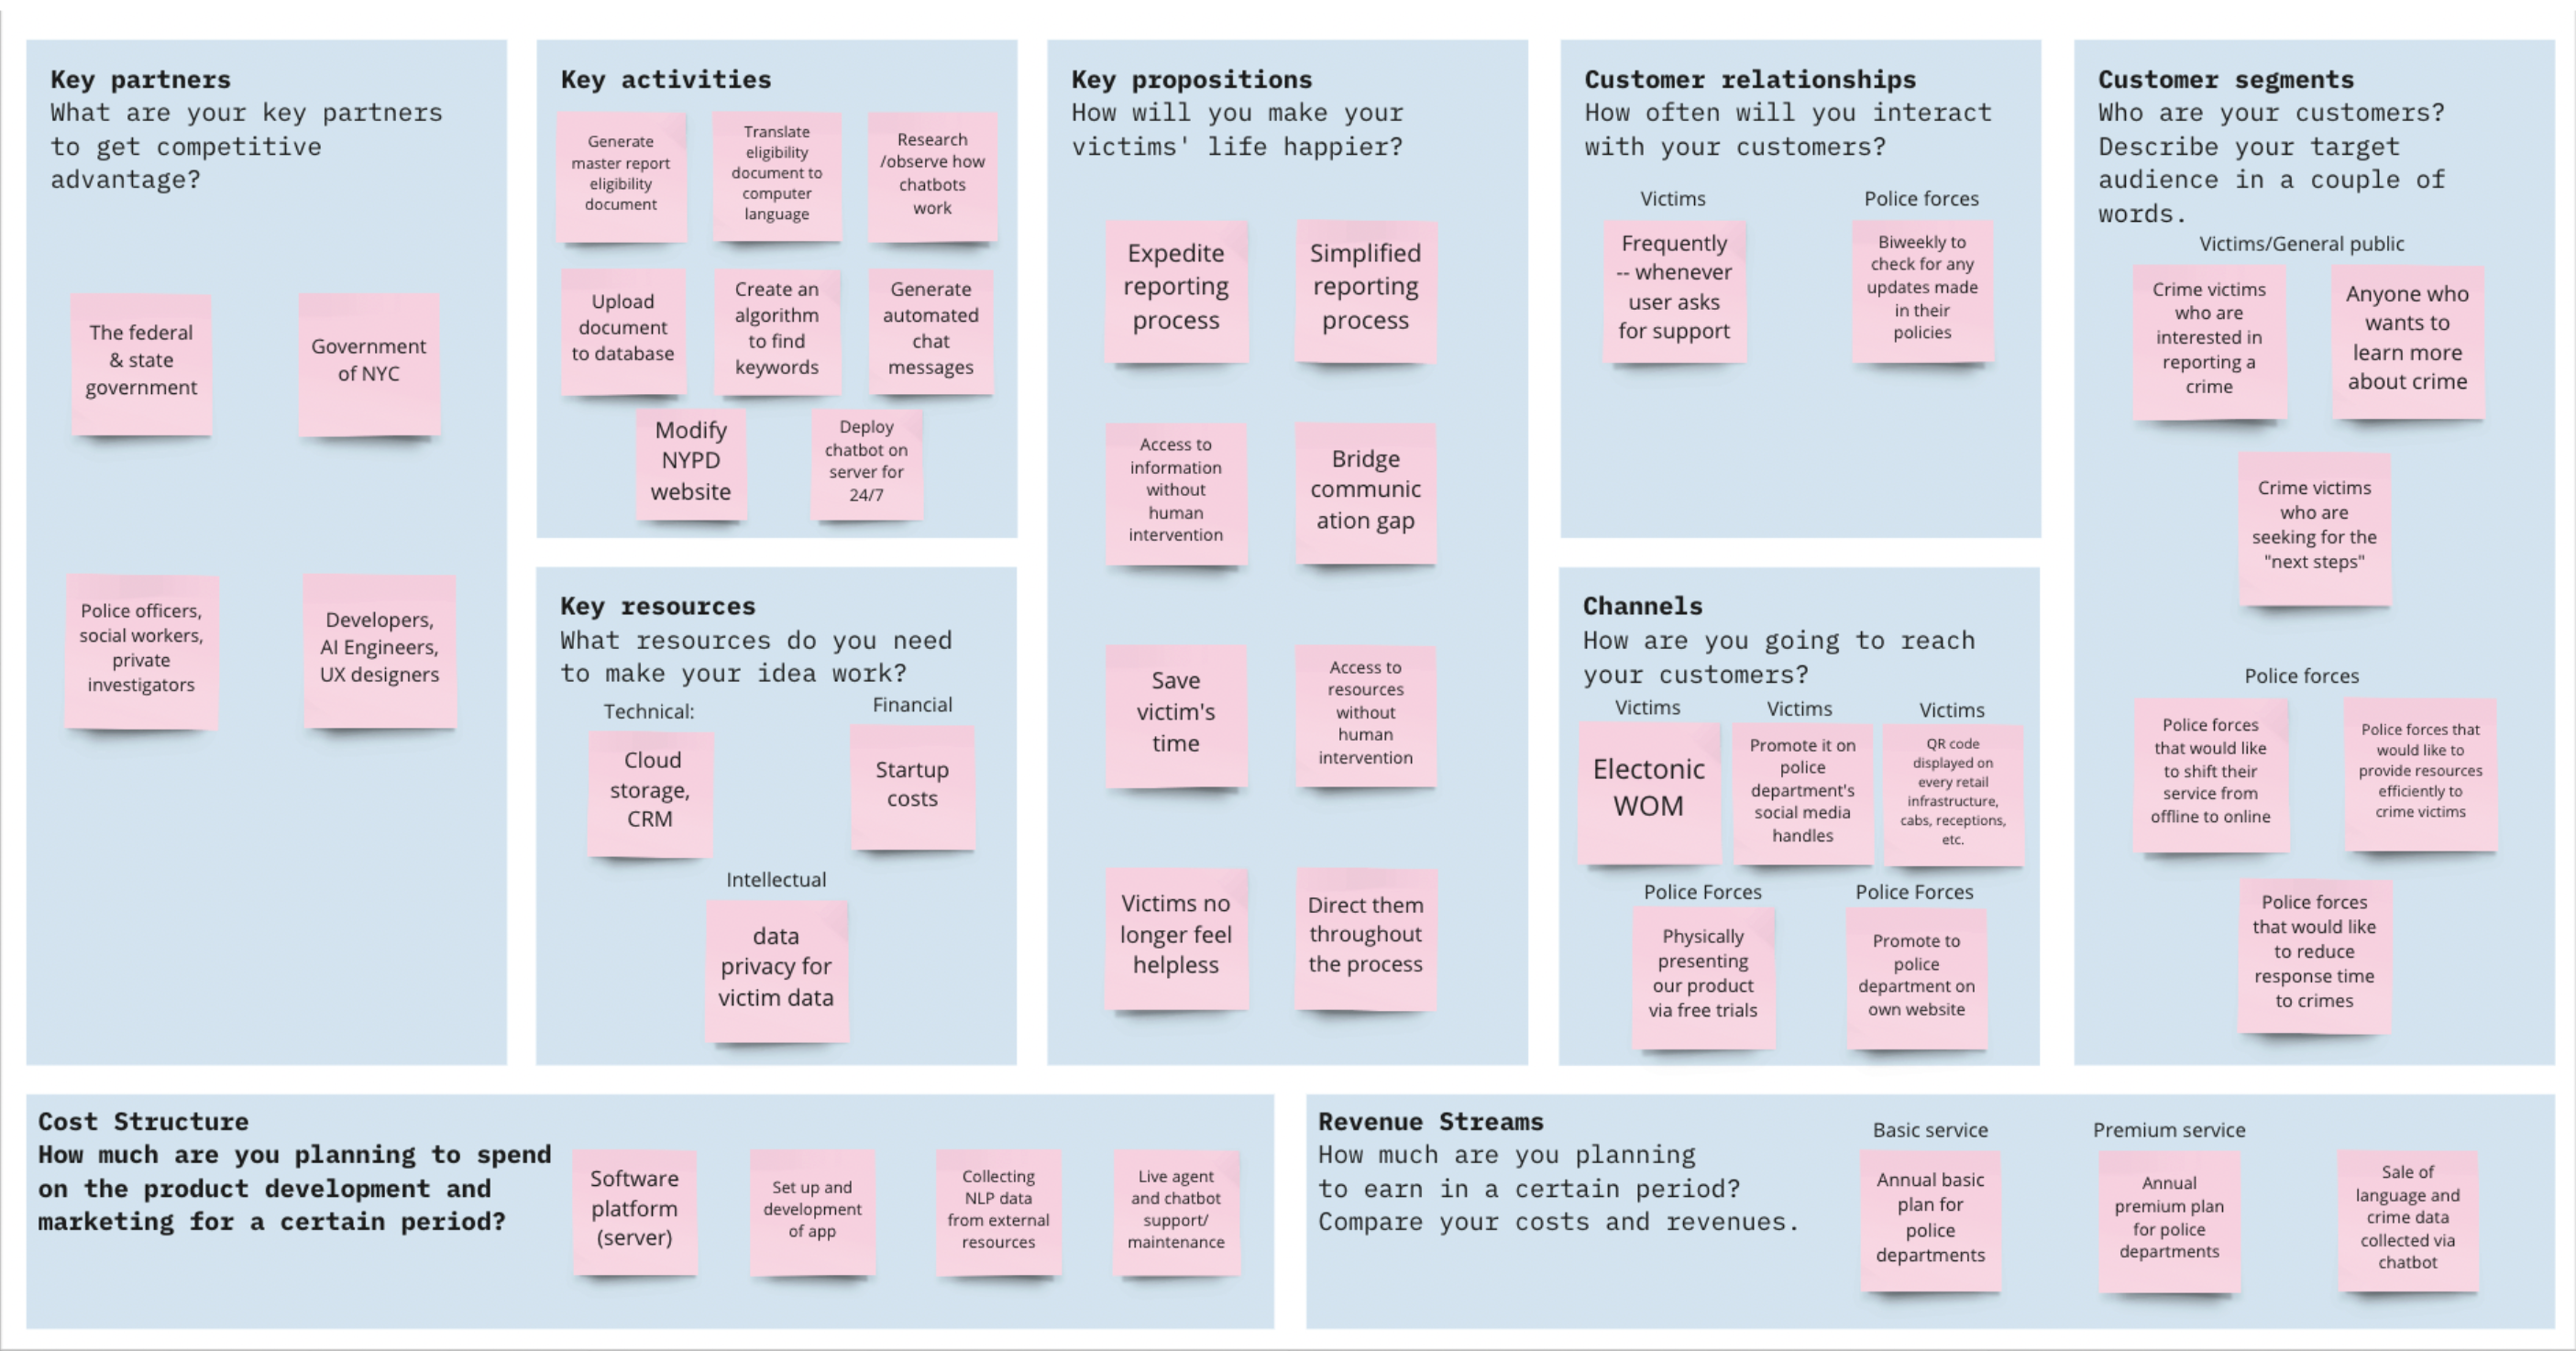
Value Chain Analysis: Business Model Canvas for the Report Eligibility Chatbot
Victims: Easier reporting, increased accessibility
Police: More data from increased volume, reduced manual labor
Public: Greater awareness of neighborhood crime
Futr & EVVA: Chatbot-based victim reporting exists, but not in NYC
IBM Watson / Ada: NLP chatbot infrastructure proven at scale
Gap: No automated intake for NYPD specifically
The solution: a report eligibility chatbot.
Data over instinct: how we validated the chatbot.
We ran three structured experiments to validate different assumptions about the chatbot's viability.
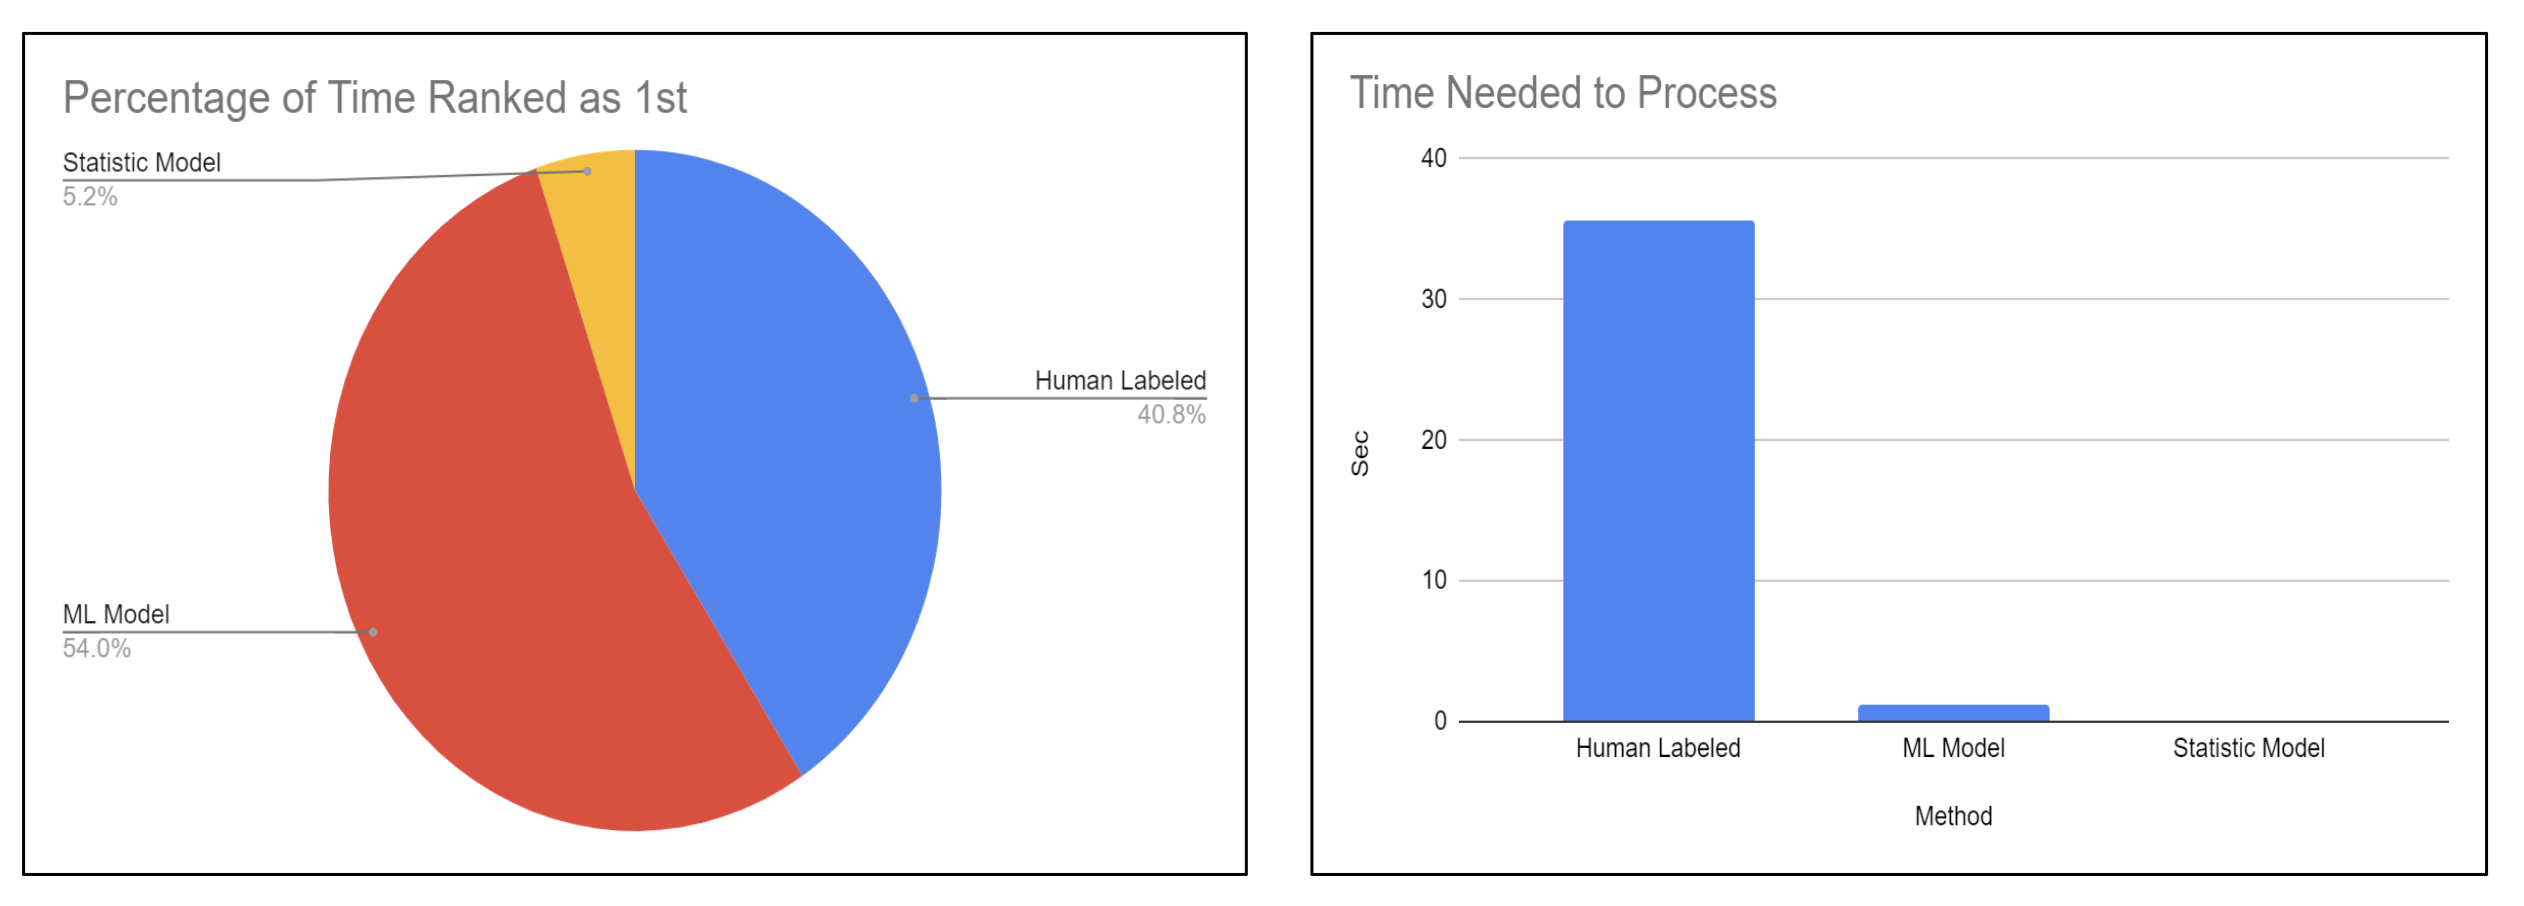
The team's developers tested ML vs. human-annotated vs. statistical models for crime keyword matching. ML was ranked first 54% of the time and processed in under 2 seconds vs. 35+ for human annotation, validating the technical approach.
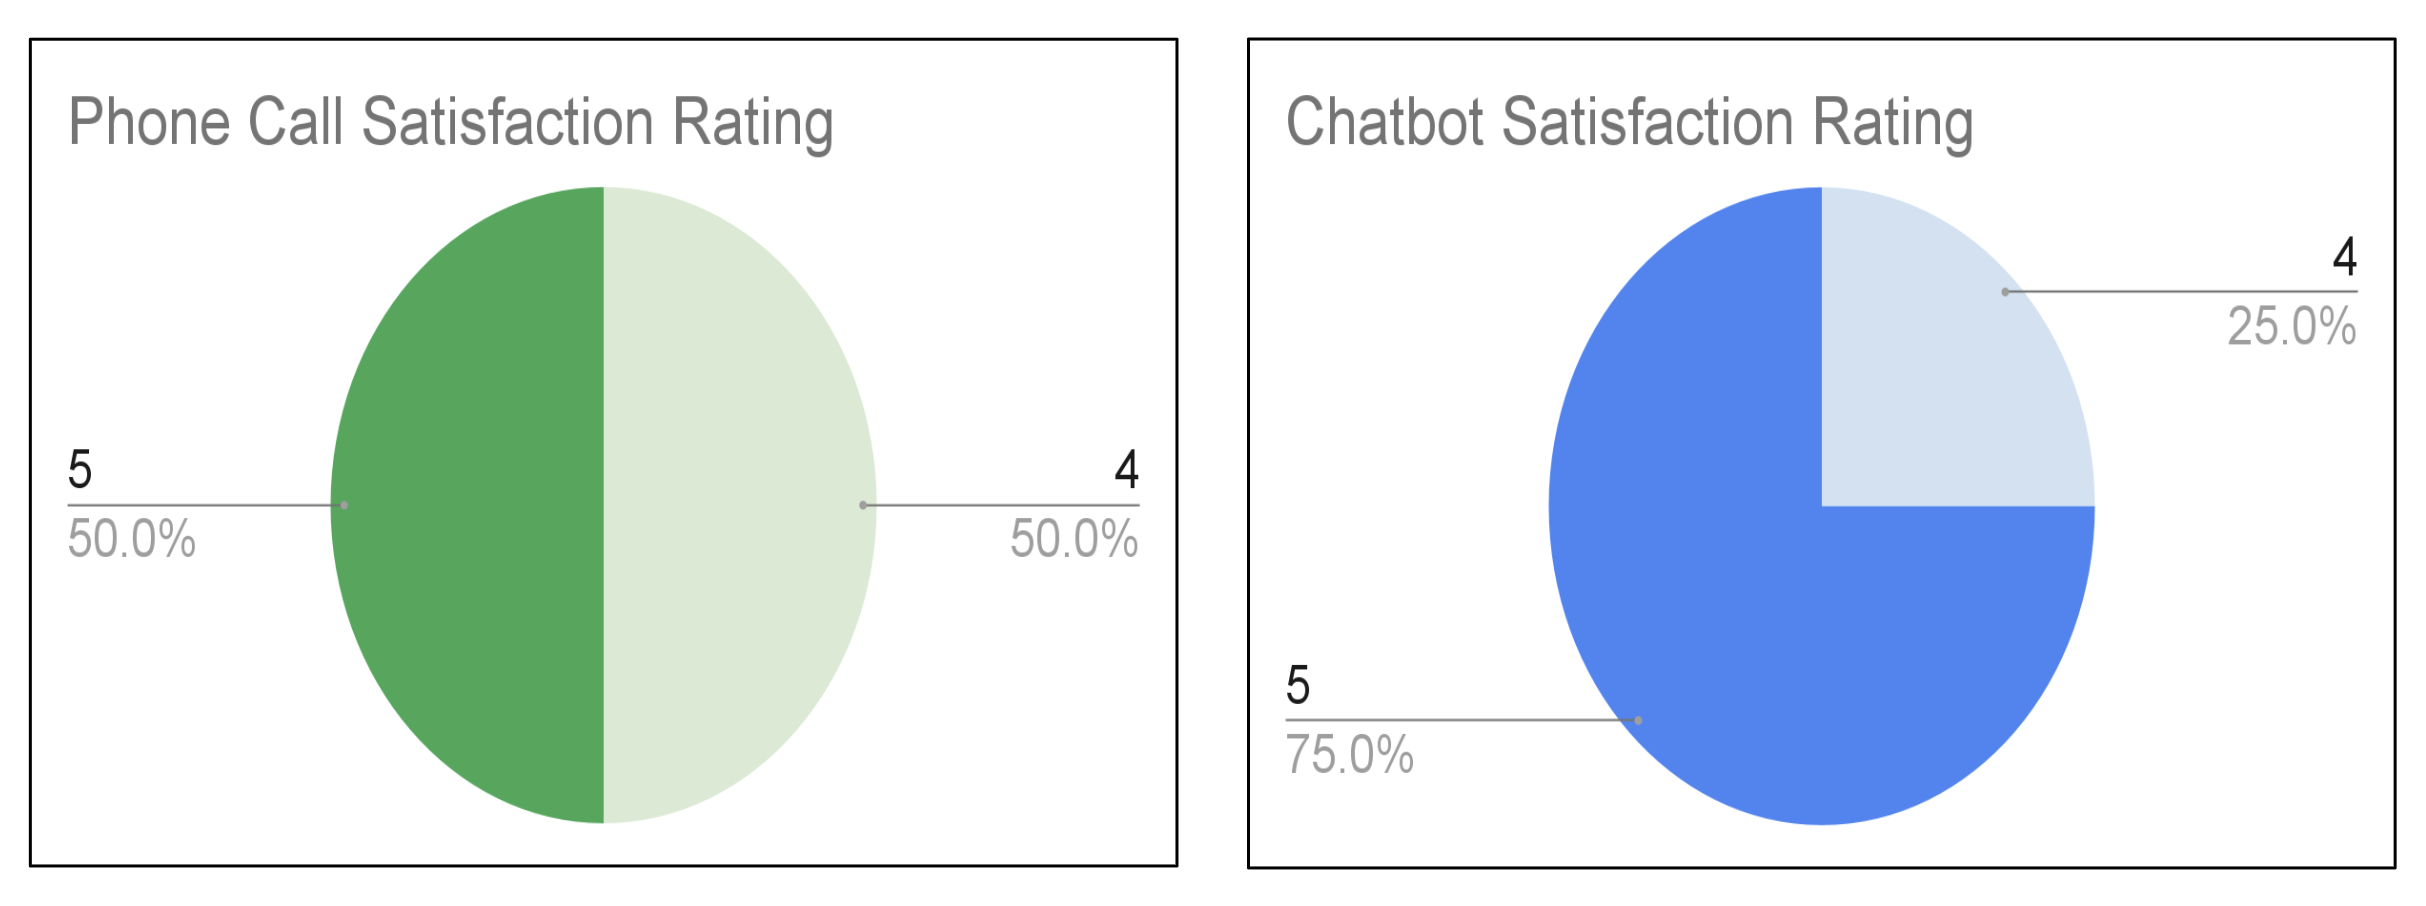
I designed this experiment with a Parsons teammate comparing our chatbot prototype against phone-based reporting. Chatbot satisfaction: 75% rated 5/5 vs. 50% for phone. Average completion: 185 seconds vs. 191 seconds.
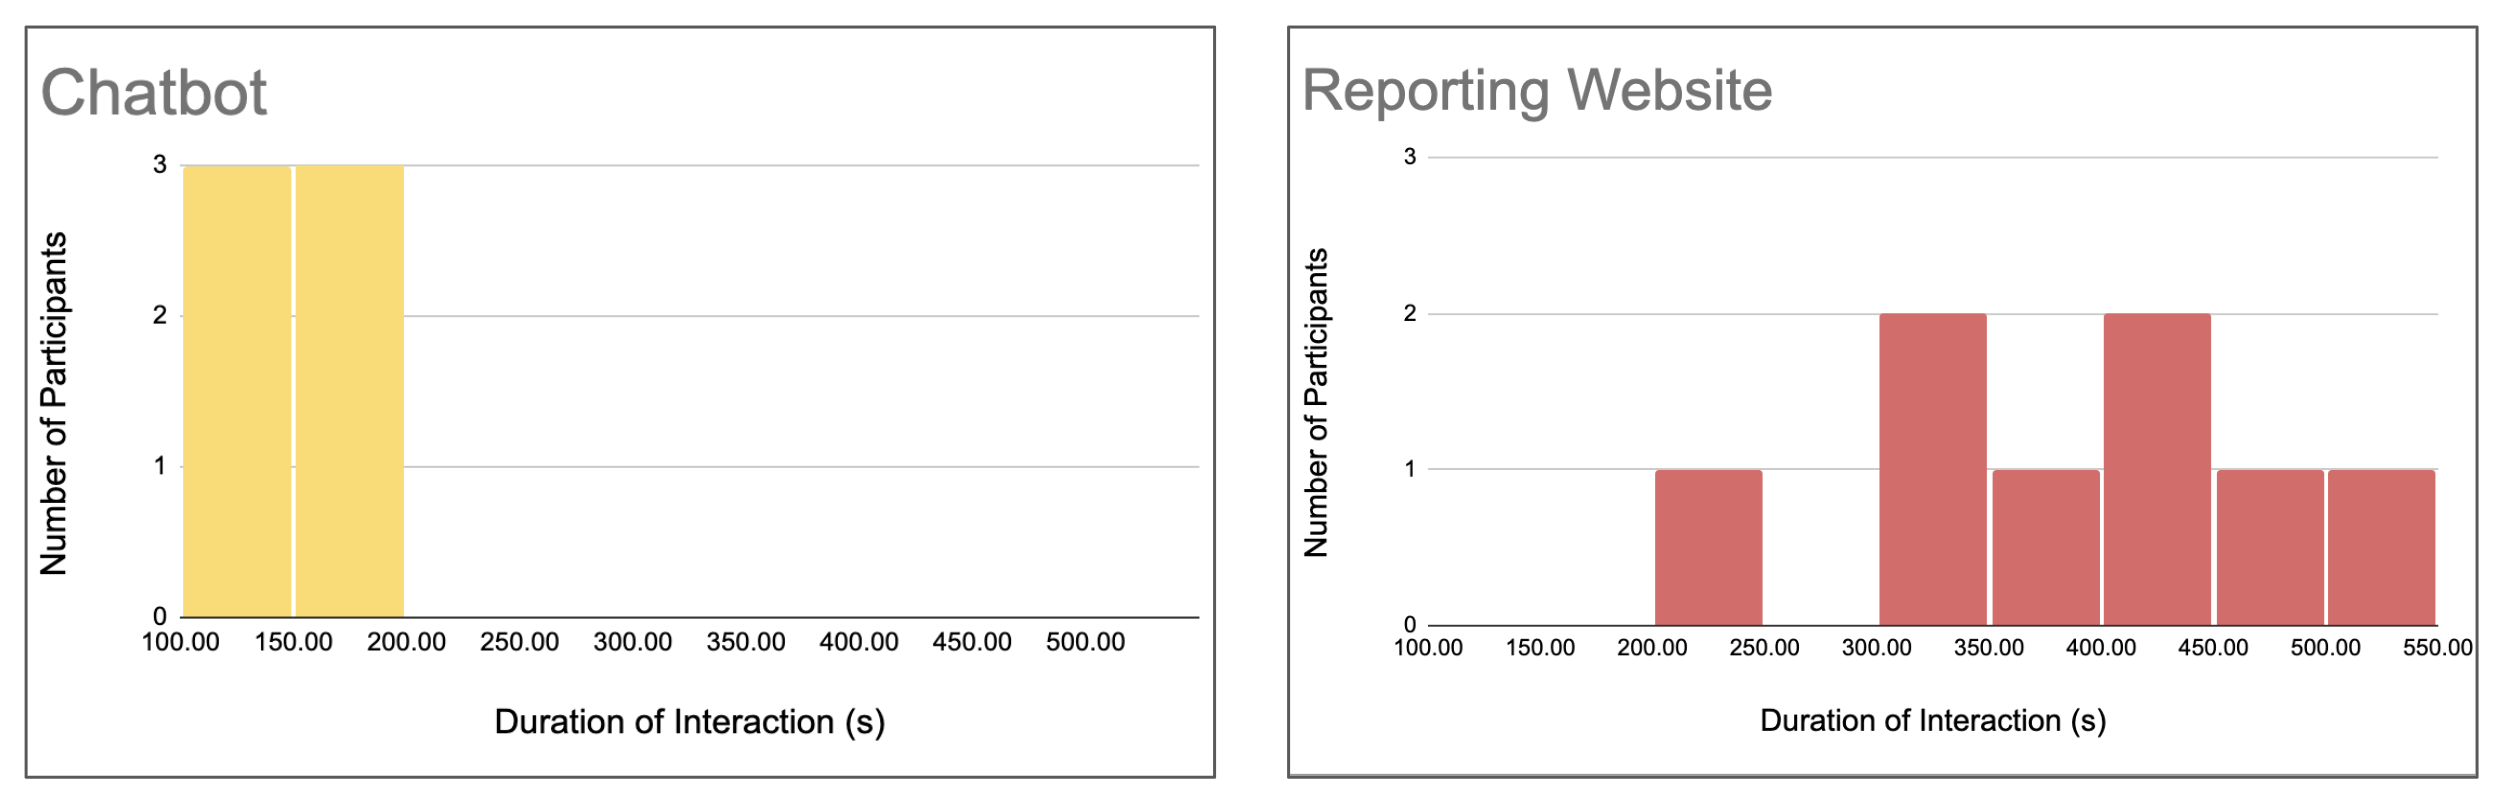
I ran this experiment comparing our Figma prototype against the actual NYPD site. Chatbot users completed tasks in 100–200 seconds clustered tightly. NYPD site users were scattered across 250–500 seconds. Faster and more consistent.
The prototype.
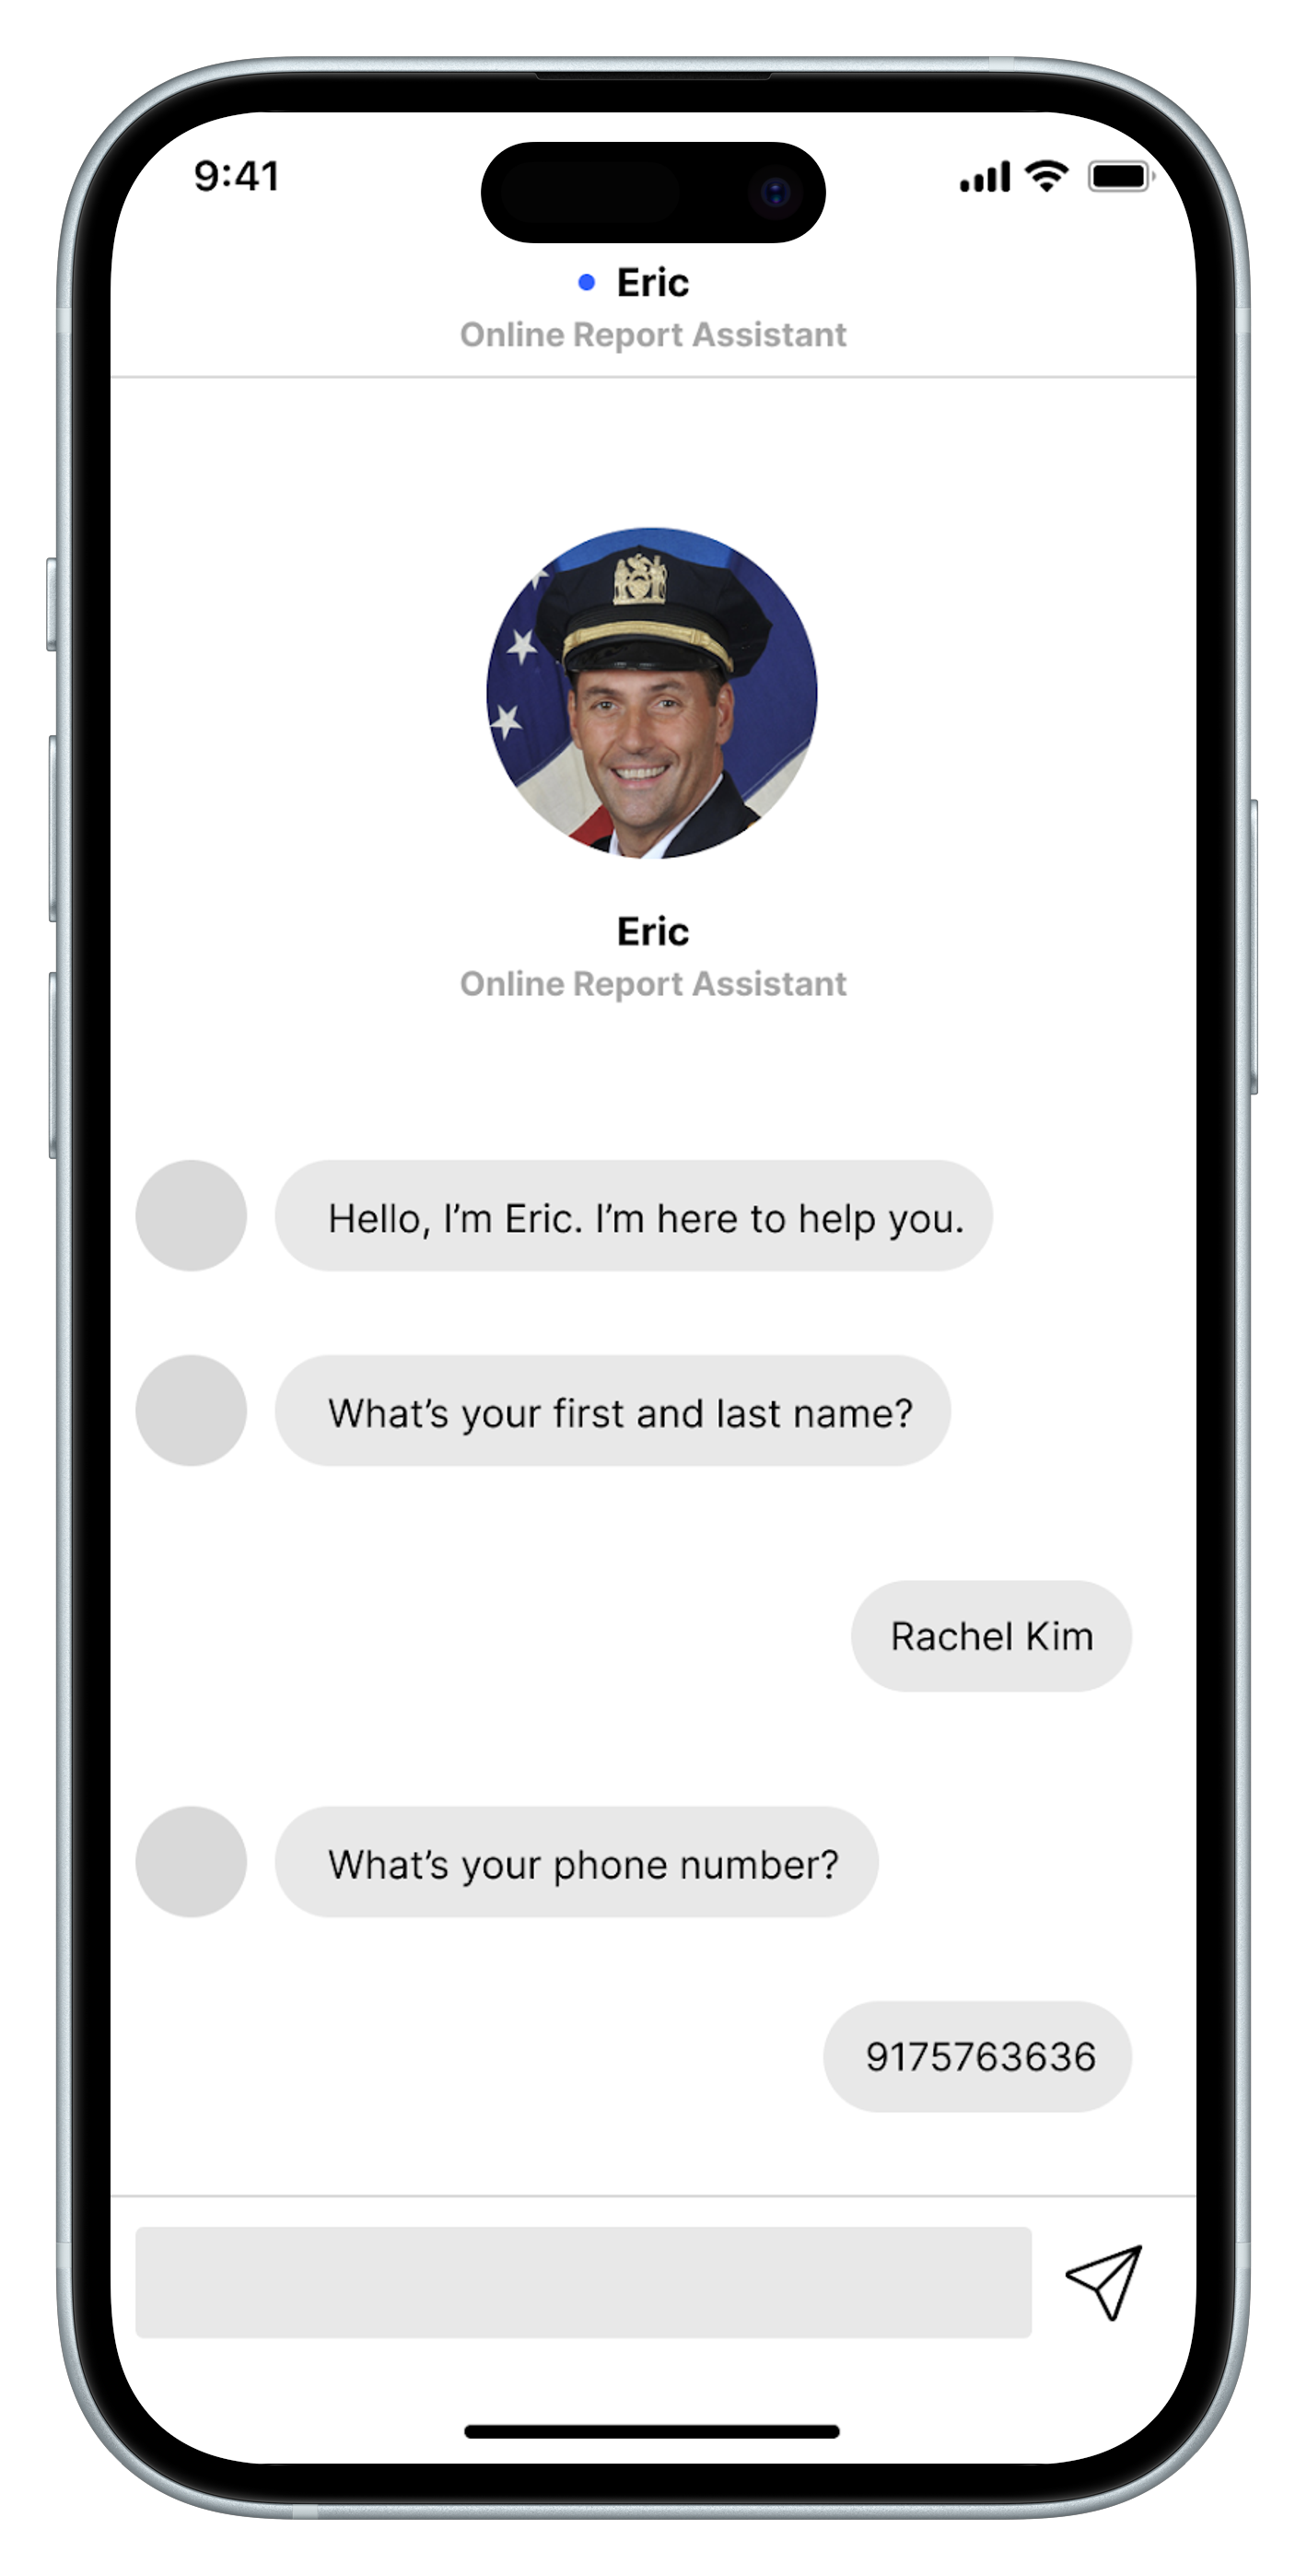
I designed the full Figma prototype with a Parsons design teammate: a mobile-first chatbot interface that mapped every screen back to a pain point from our research.
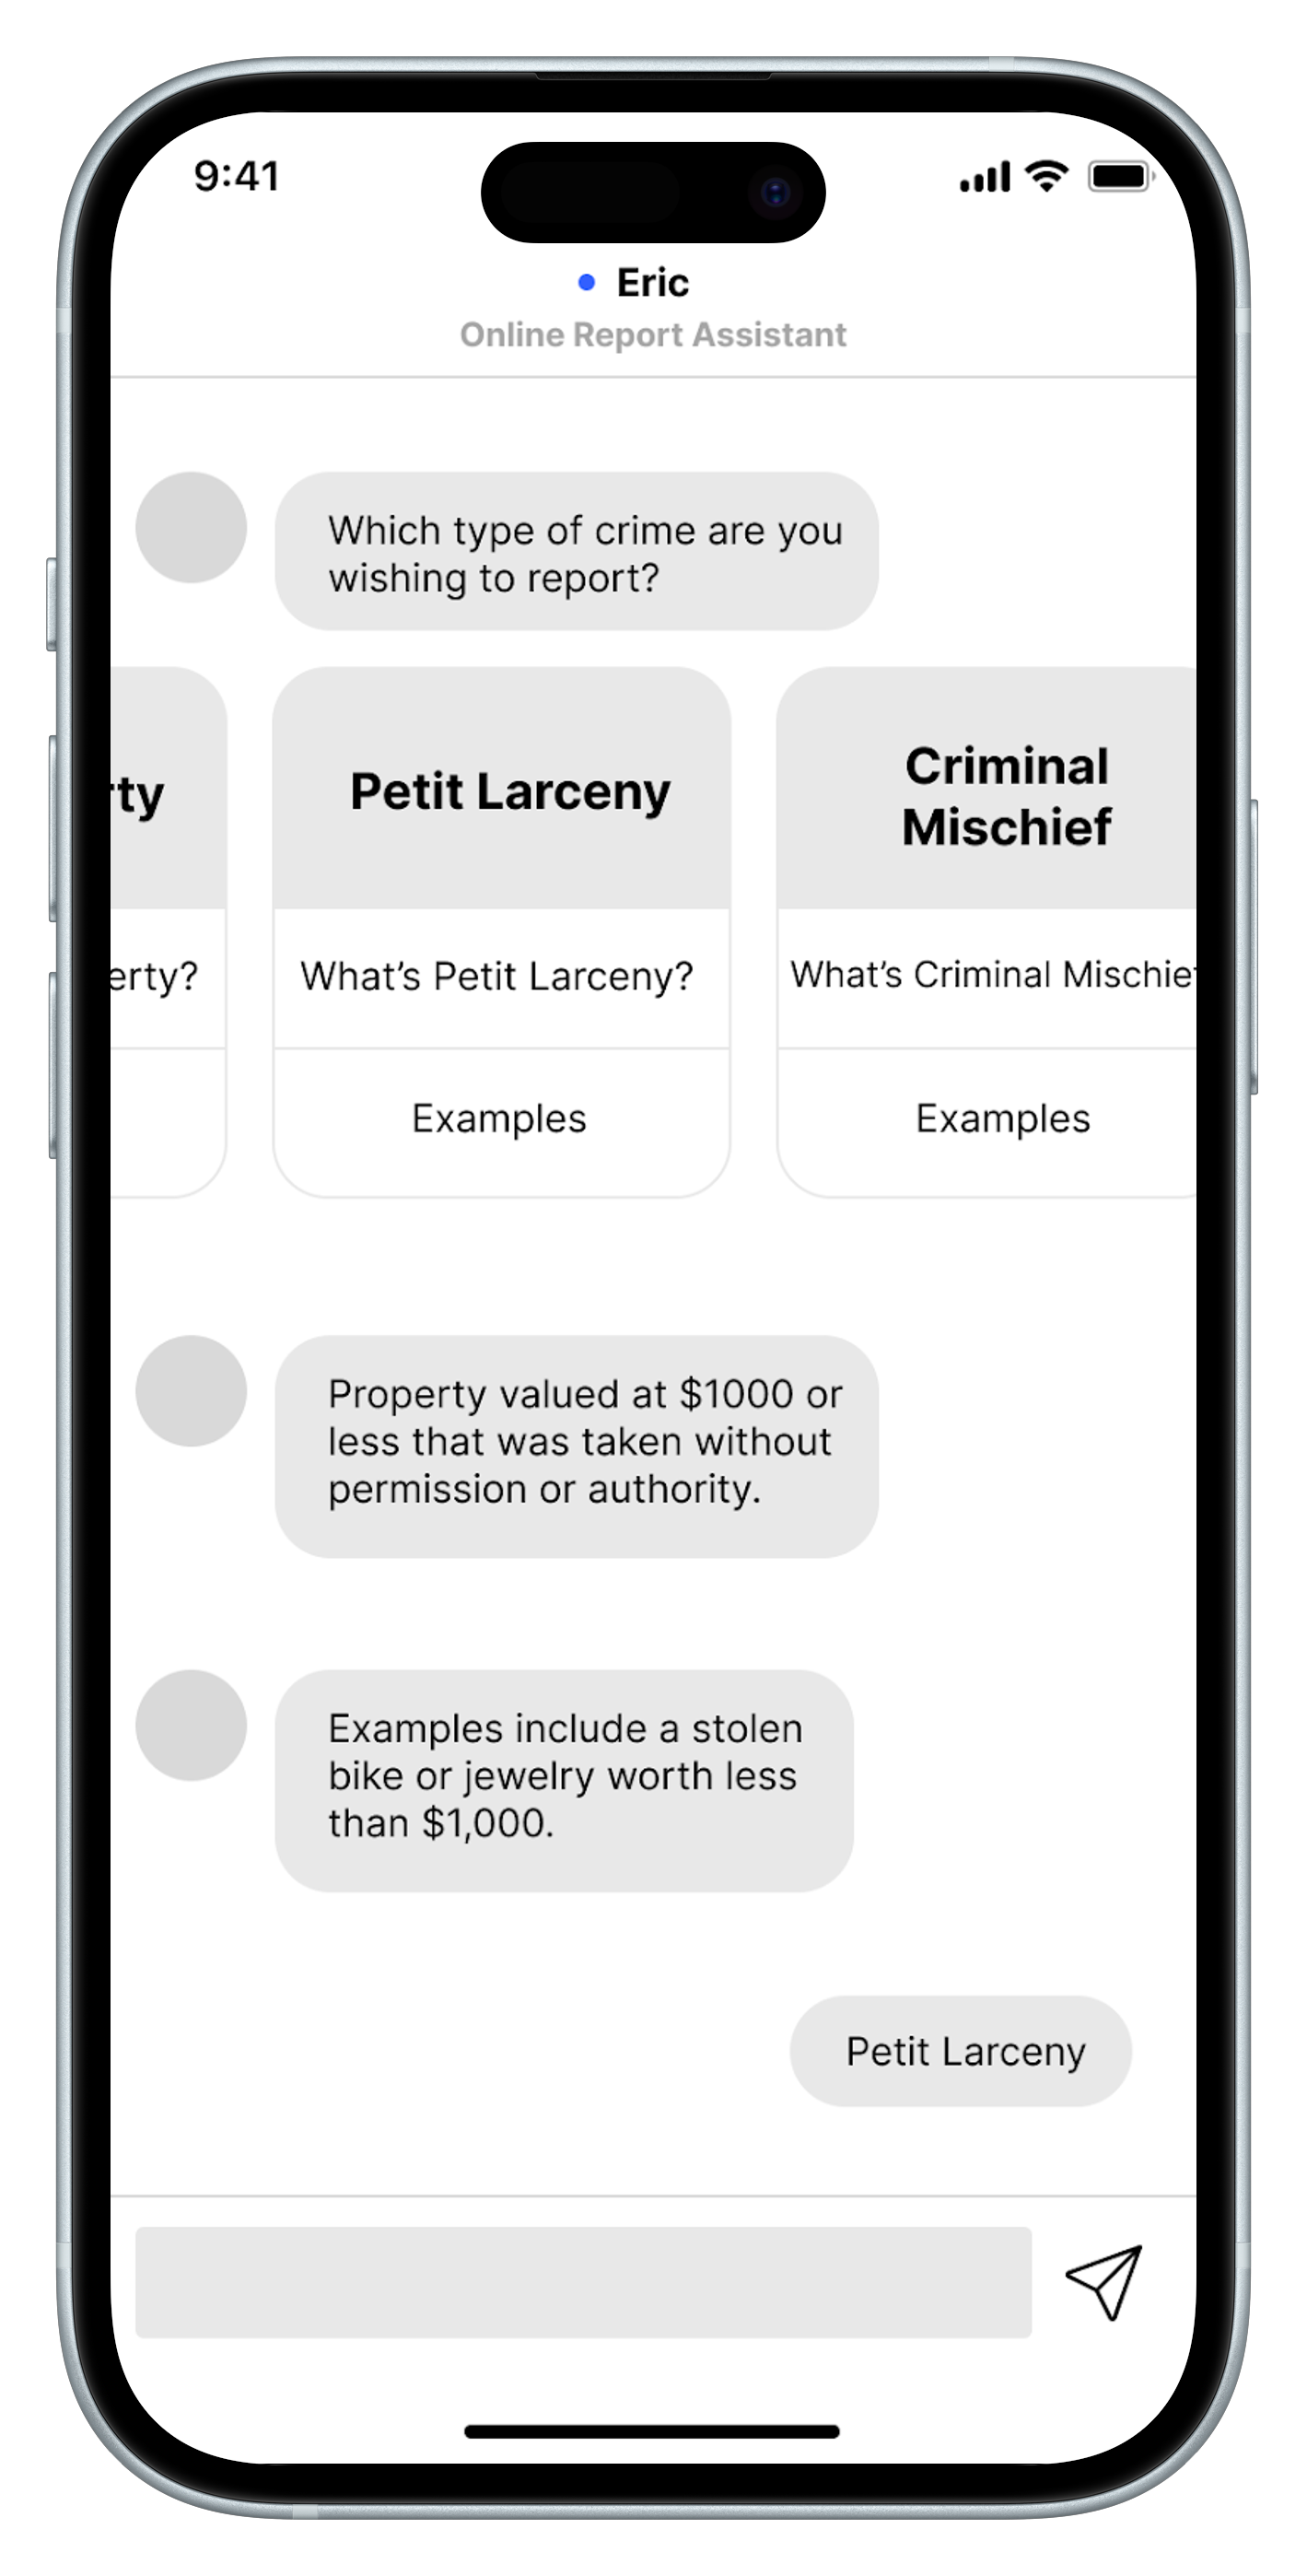
Replaced the NYPD site's static dropdown with tappable cards and expandable context, so users could self-assess eligibility without leaving the flow.
Built real-time checks for date and address directly into the conversation, catching errors before submission instead of failing silently like the NYPD site.
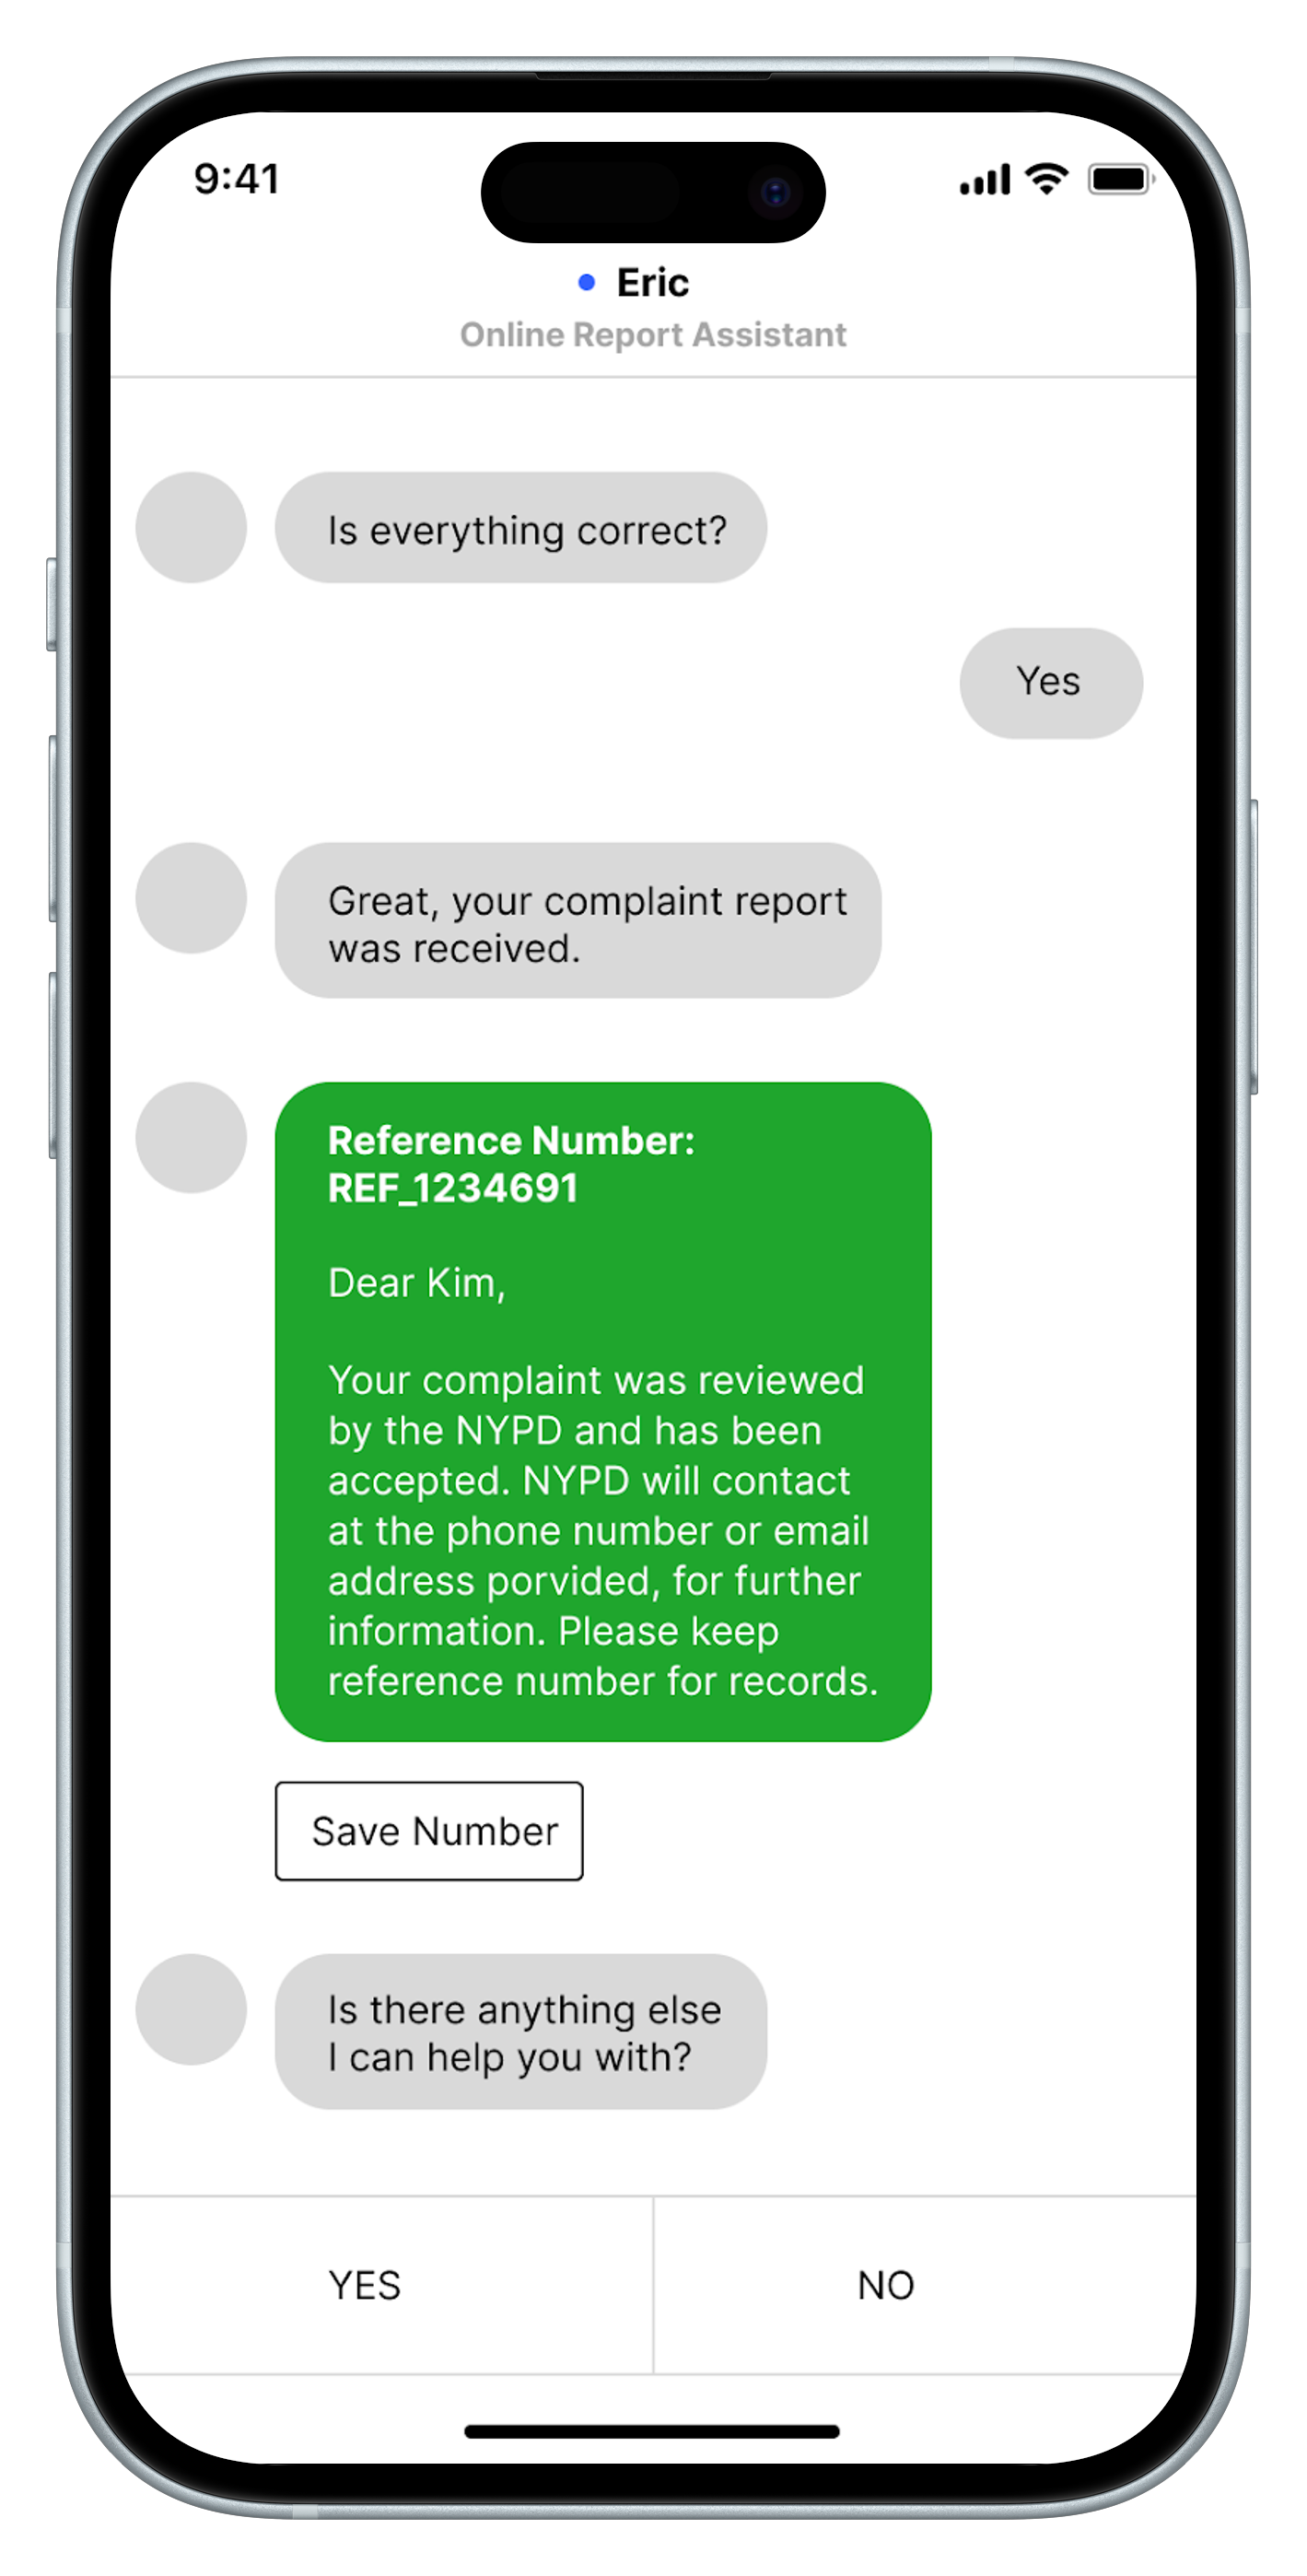
Designed distinct accepted/rejected screens with actionable next steps, not the ambiguous email NYPD sends days later.
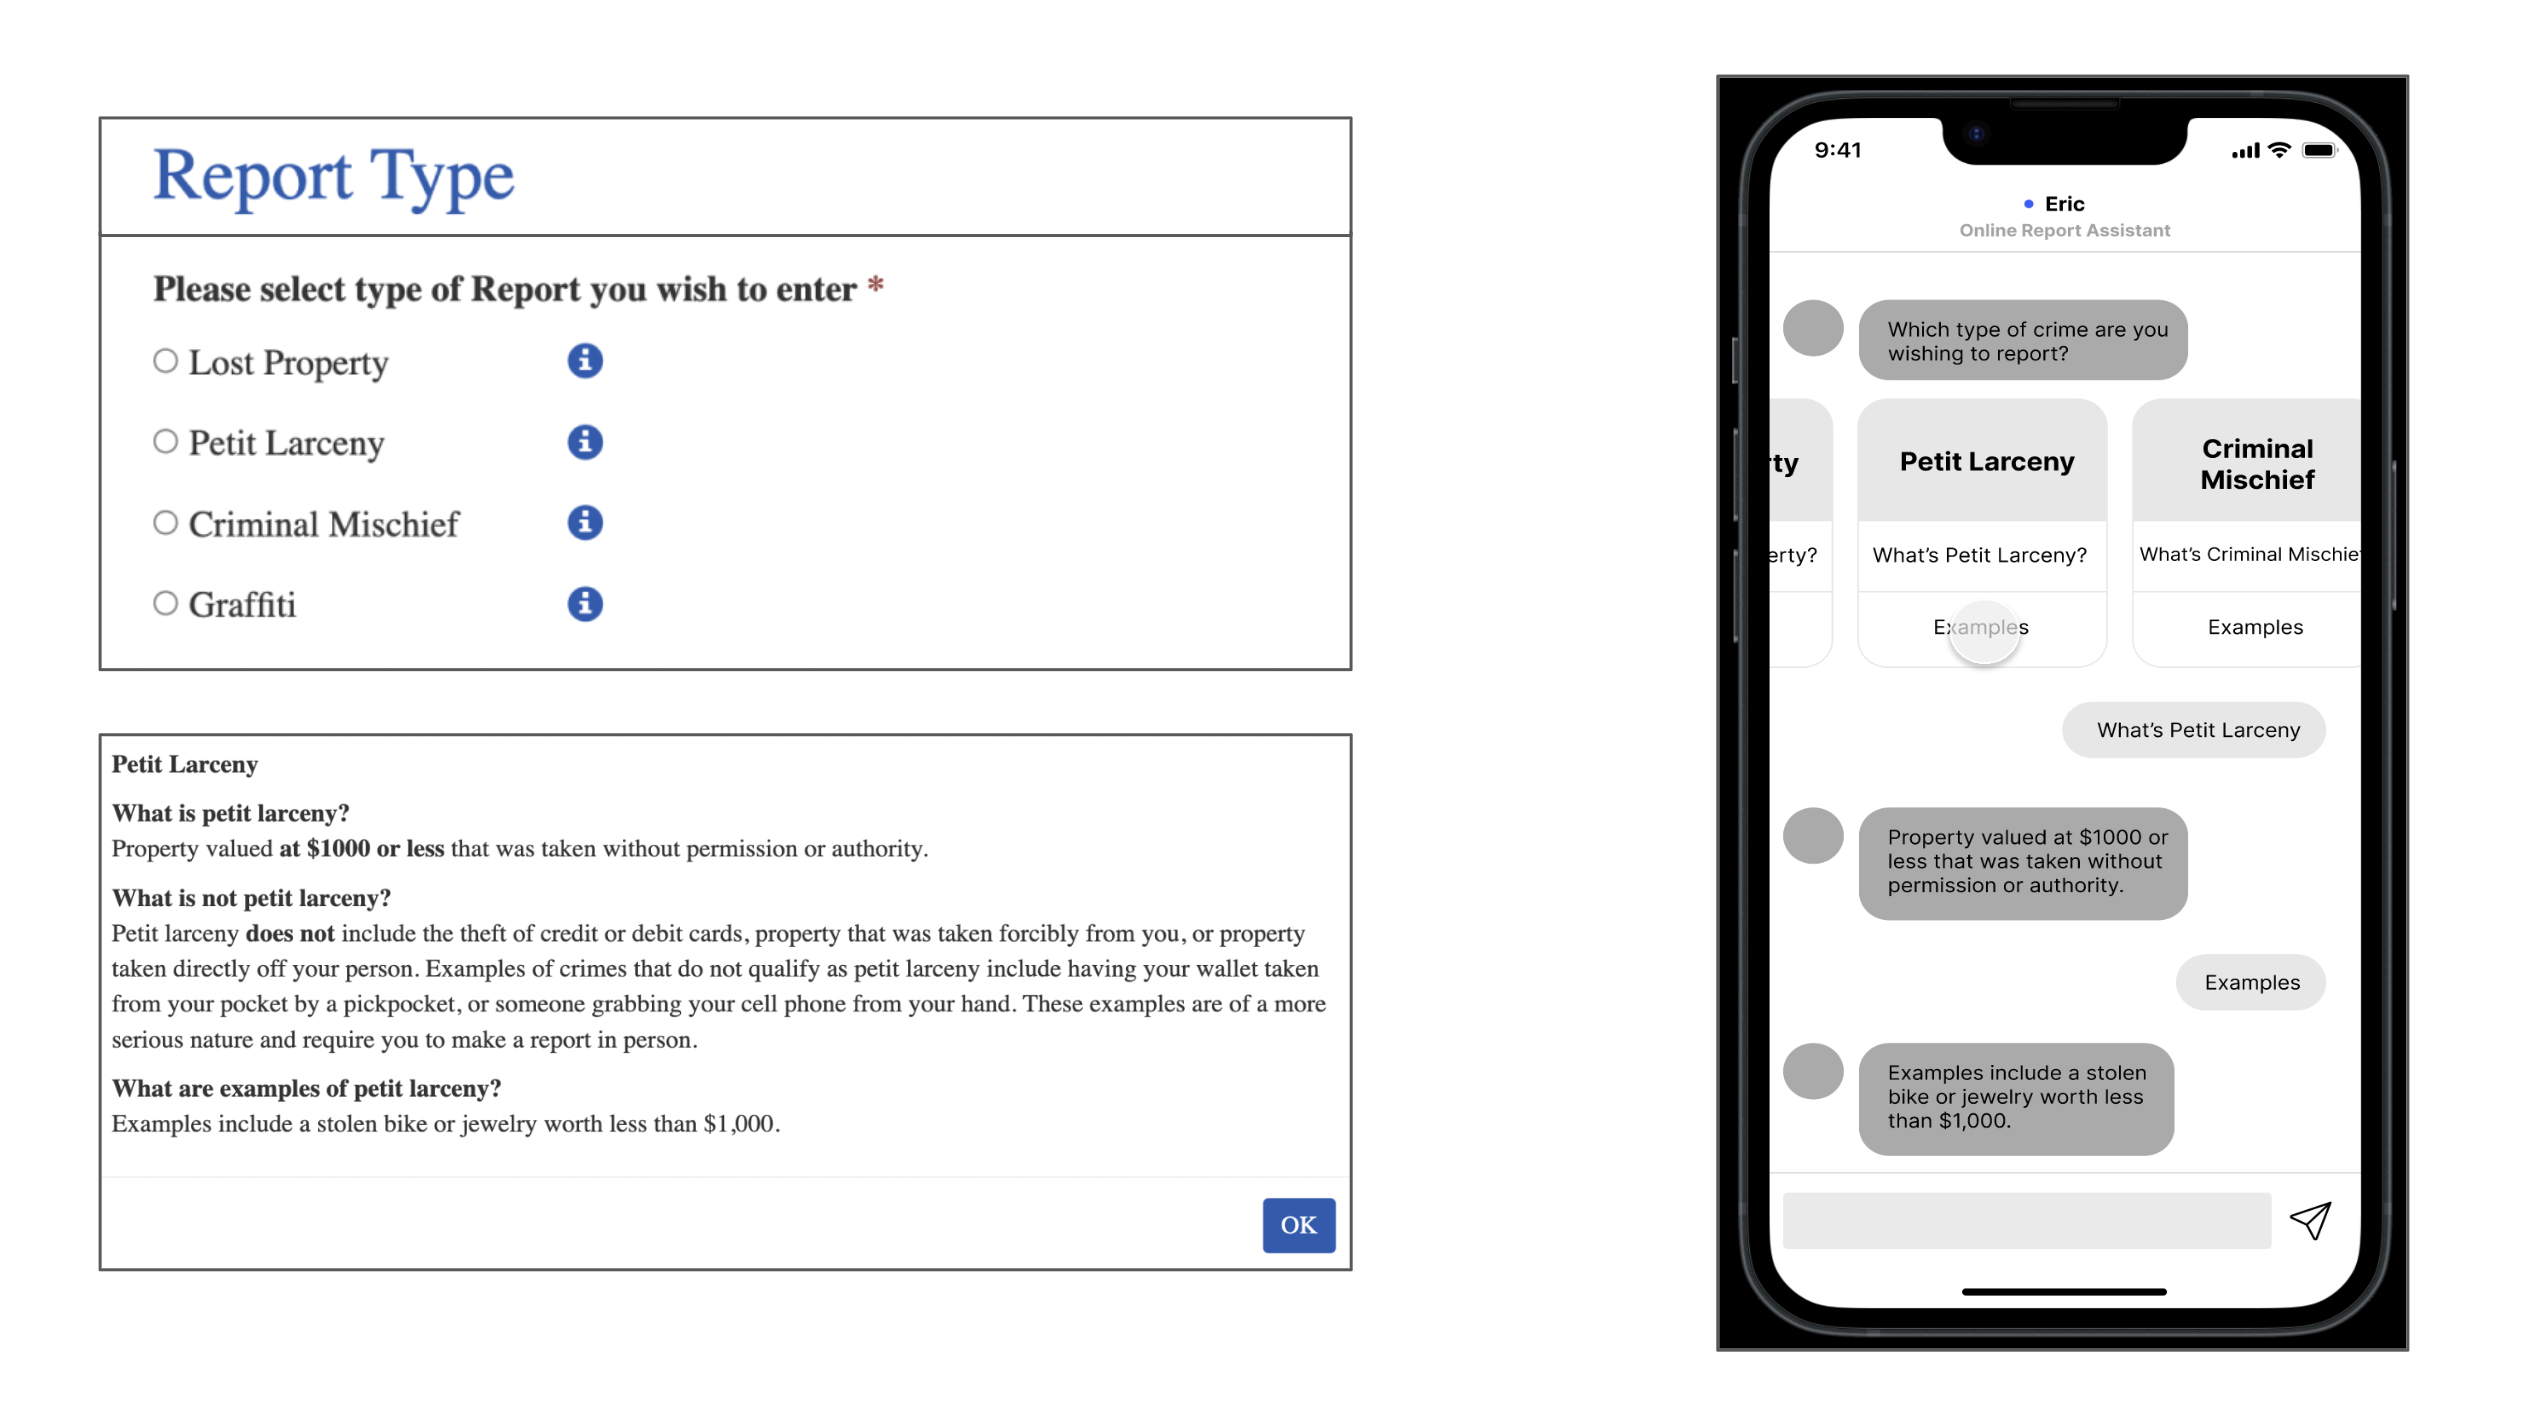
Static dropdown with no context vs. tappable cards with expandable definitions
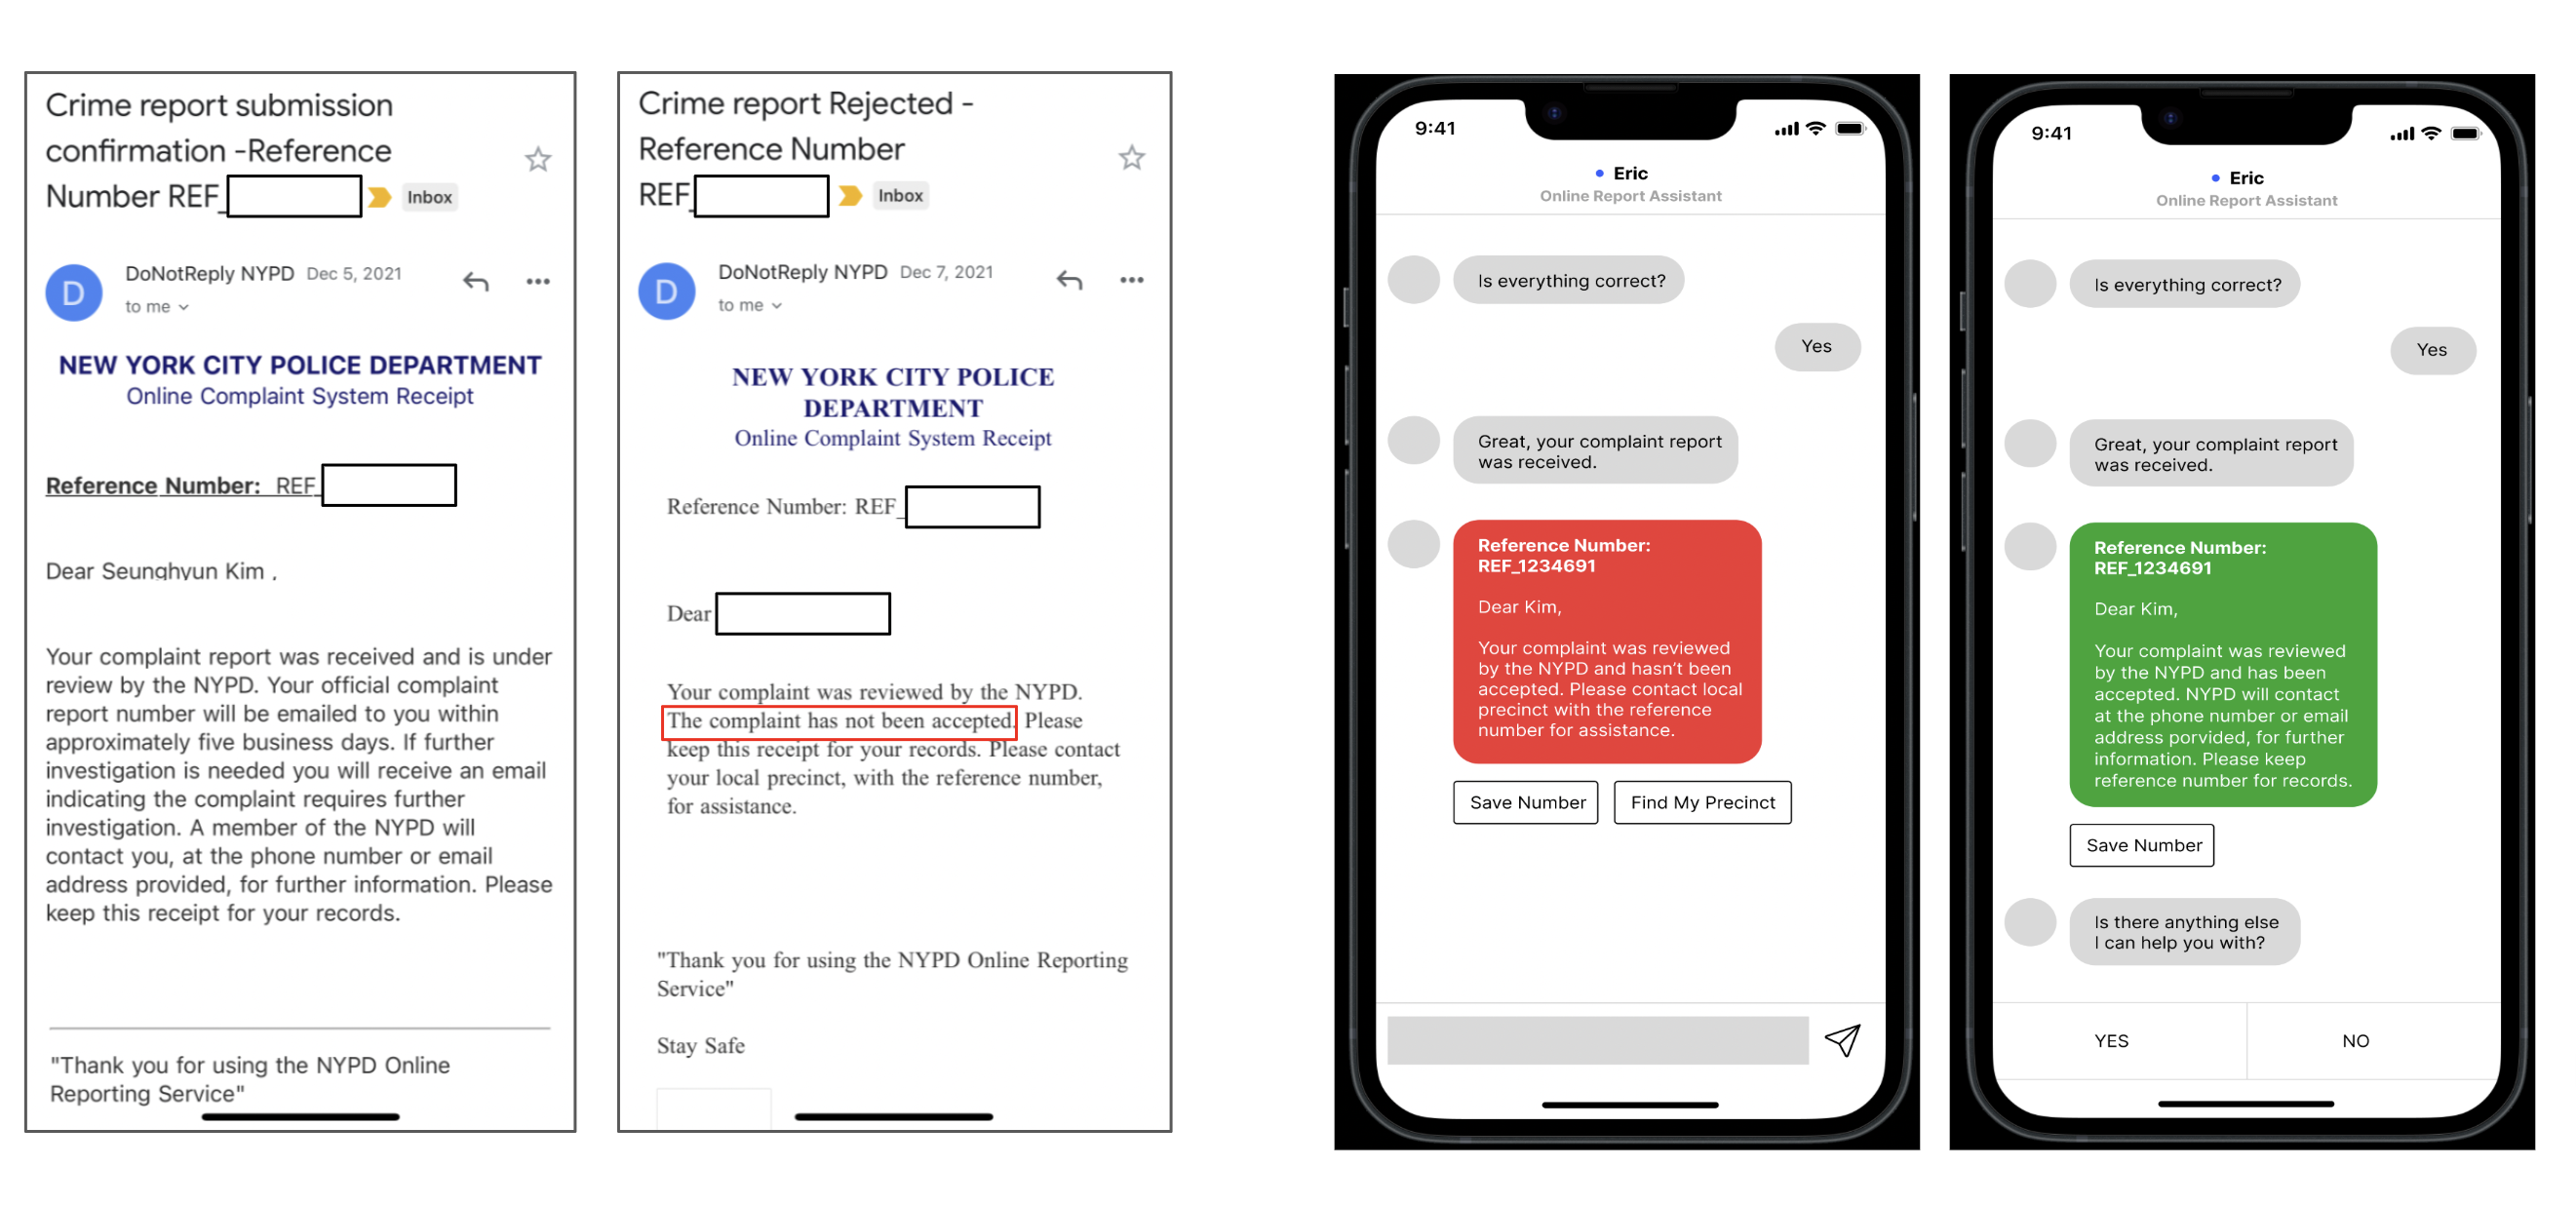
A vague email days later vs. an immediate outcome with actionable next steps
These are select screens from the prototype. Explore the complete interaction flow on Figma →
Measuring what matters.
Our North Star metric was report completion rate: the percentage of victims who successfully finish a report versus abandoning mid-flow. One number that captures both accessibility and usability, and the clearest signal of whether the chatbot was actually solving the problem.
While we recognize that NYPD may be constrained on resources and time, we recommended they adopt the chatbot as a long-term investment. The tool would save both victims and officers significant time while improving the overall crime reporting experience in New York City.